Visualize and analyze

If a picture is worth a thousand words – a 3D model is worth a million
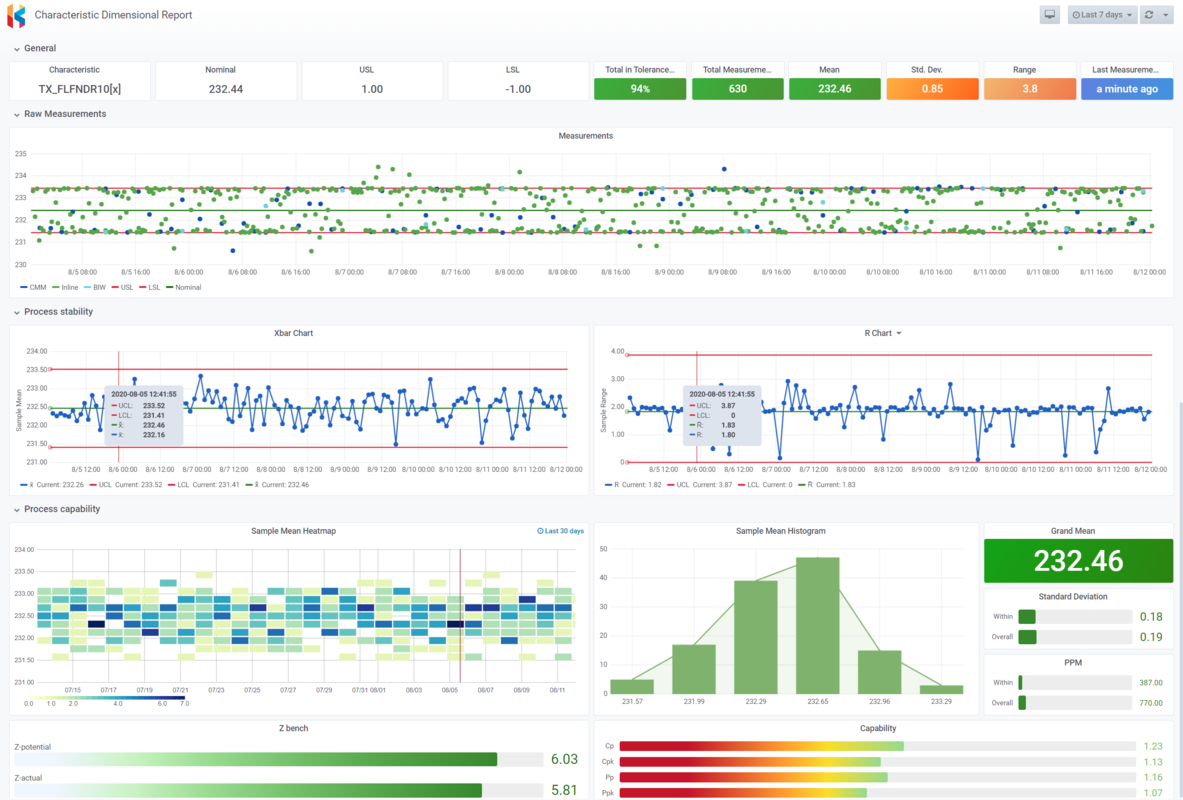
SPC characteristic dimensional report dashboard

Make smart decisions

Analyze historical measurement data from internal sources, as well as your suppliers. Combine different types of metrics such as room temperature, air pressure, or luminosity to gain unprecedented operational insight.

Solve problems

Apply statistical process control (SPC) techniques at scale and visualize your data using 3D models. Pinpoint sources of variation, discover relations and patterns easier, and also spot anomalies faster.

Monitor and optimize

Keep a pulse on how your production is performing to easily track down process issues before they become serious problems. Know where to focus your time, energy, and resources to improve results and your bottom line.

SPC characteristic dimensional report dashboard visualization

Interactive visualizations

Make your measurement data visible and easy to understand with pixel-perfect visualizations.

  • Charts, tables, gauges, heatmaps, geomaps, and more
  • Add context to data with balloon, panel, and dashboard links
  • Use variables and let users dynamically explore your data
  • Annotate graphs with rich events from different data sources

CAD

Let everyone interact with 3D models and data together to discover insights that would otherwise be lost.

  • Display multiple CAD models in a web browser
  • Intuitively control 3D objects using touch gestures
  • Load from cloud storage, web URLs, or your local file server
  • Built-in Cloud CAD file manager
Multi-CAD SPC dashboard
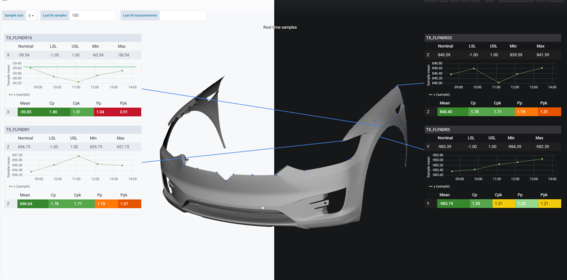
Tesla Model X front left fender CAD dashboard balloons

Balloons

Augment your CAD model with interactive analytics using customizable balloons.

  • Create multiple metric dimensions with custom balloon views
  • Use charts and tables to visualize your data dimensions
  • Built-in templates for common features like point, circle, slab, etc.
  • Data-driven, conditional styling and thresholds

TV ready

Turn your data into engaging live TV dashboards
  • Use Kiosk and TV mode to hide navigation, menus, or both
  • Display your dashboards in sequence using Playlists
  • Your dashboards scale to any screen size
  • Dark and light themes
KensoBI dark and light theme
KensoBI dashboard management

Management

Stay organized and keep your dashboards accessible.

  • Group dashboards in folders and assign permissions.
  • Star or tag dashboards for quick filtering
  • Easily import and export to human-readable JSON file
  • Track and roll back changes with dashboard revision history

Ready to get started?

Start building modern analytics dashboards with KensoBI.
Deploy your way, cloud or on-premise.